Tenerife Weather by Month
Tenerife's weather splits by altitude and by coast, so a single island forecast never tells the whole story. Here is what the official station records say, month by month.
Short answer
Tenerife's south coast averages 18 to 25 C across the year, with July and August the warmest months and January the coolest. The north is greener and wetter, the mountains are genuinely cold, and the sea stays between 19 and 24 C.
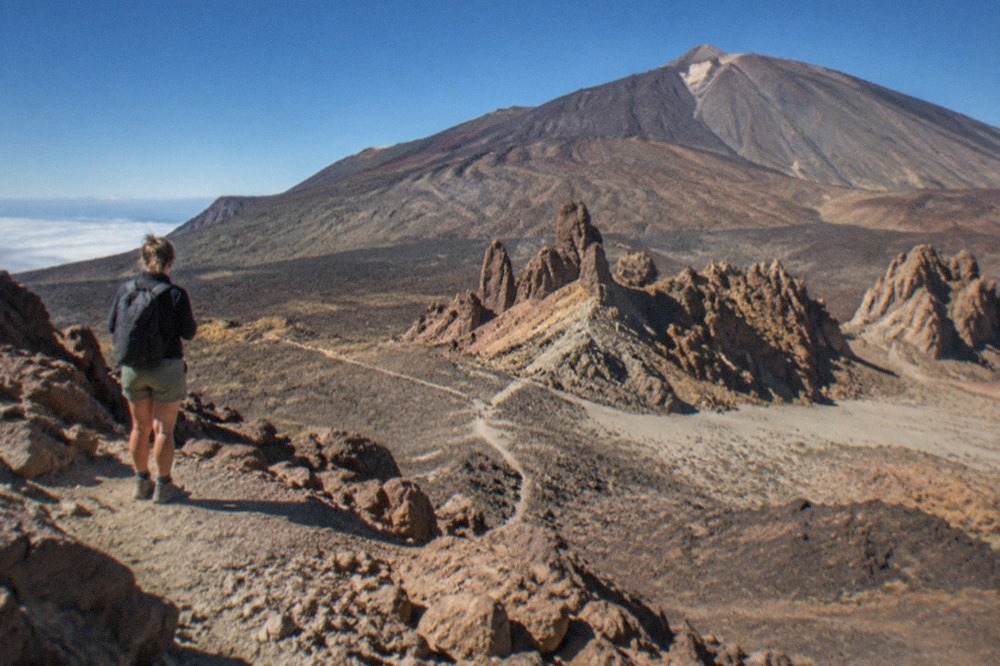
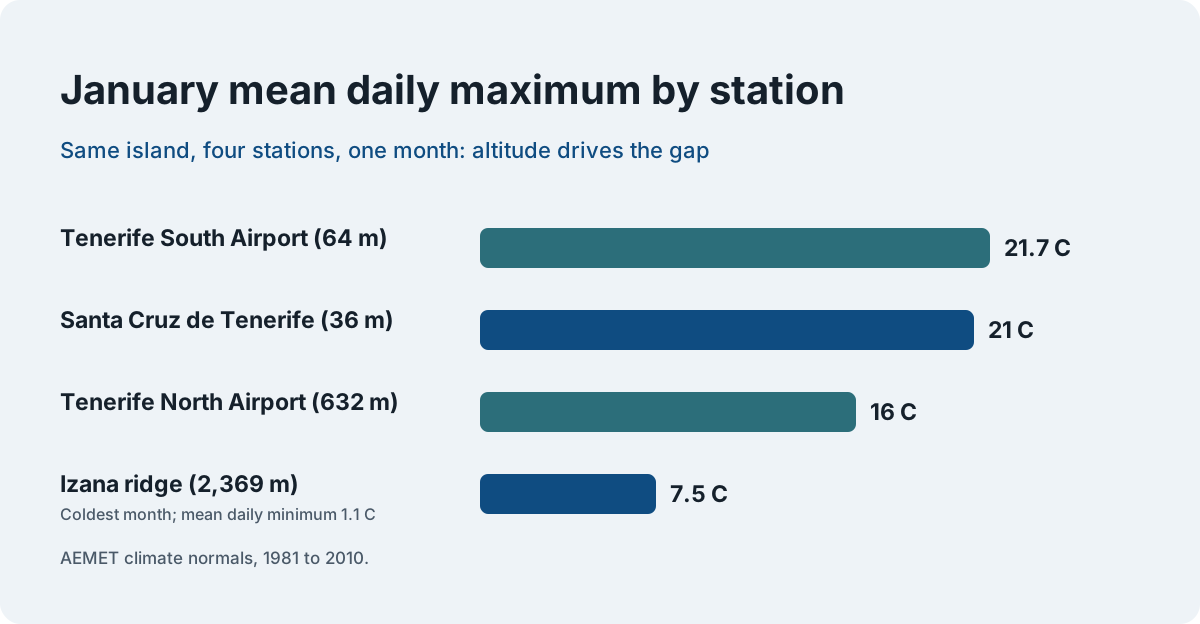
Tenerife sits close enough to the African coast that its beaches stay swimmable in midwinter, yet its central volcano is high enough to hold snow. AEMET's climate normals put the January mean daily maximum at 21.7 C at Tenerife South Airport and at 7.5 C on the Izana ridge beside Teide, 2,369 m up, in the same month. One island, two entirely different weather worlds, and most of this guide exists to explain the gap between them.
The figures below come from AEMET's published climate normals for the period 1981 to 2010, recorded at four stations: Tenerife South Airport at 64 m, Tenerife North Airport at 632 m, Santa Cruz de Tenerife at 36 m, and Izana at 2,369 m. Sea surface temperatures are a separate dataset, NOAA's OISST normals for 1991 to 2020, and the two periods are never mixed. Every claim on this page stands on one of those station tables, which is why the numbers sometimes disagree with the round figures repeated in holiday brochures. This editorial desk at Tenerife Travel Guide reports what the instruments recorded.
How Hot Is It in Tenerife by Month?
At Tenerife South Airport the mean daily maximum runs from 21.7 C in January to 28.4 C in August, with the mean daily minimum never dropping below 15 C in any month. July and August are the hottest months at 27.7 C and 28.4 C, December and January are the coolest, and the spread between the warmest and coldest month is under seven degrees. In Santa Cruz the pattern is nearly identical, from 21 C in January to 29 C in August.
That narrow spread is the single most useful thing to know about Tenerife weather. The island has no month that a northerner would call cold, and no month that approaches the furnace heat of the nearby African mainland in high summer. The tourist board's own figures for 2025 record 5,451,268 tourists lodged in hotels and apartments, spread across every month of the year, and the monthly air-arrival figures below show how evenly the demand is distributed.
Here are the AEMET normals for Tenerife South Airport, the station closest to the main resort belt:
| Month | Mean daily max C | Mean daily min C | Mean C | Rain mm | Rain days 1 mm+ | Sunshine hours |
|---|---|---|---|---|---|---|
| Jan | 21.7 | 15.2 | 18.4 | 17 | 1.8 | 193 |
| Feb | 22.0 | 15.0 | 18.5 | 20 | 2.2 | 195 |
| Mar | 23.1 | 15.6 | 19.3 | 15 | 1.9 | 226 |
| Apr | 23.1 | 16.0 | 19.5 | 7 | 1.1 | 219 |
| May | 23.9 | 17.0 | 20.4 | 1 | 0.3 | 246 |
| Jun | 25.4 | 18.8 | 22.1 | 0 | 0.0 | 259 |
| Jul | 27.7 | 20.2 | 24.0 | 0 | 0.0 | 295 |
| Aug | 28.4 | 21.1 | 24.7 | 1 | 0.2 | 277 |
| Sep | 27.9 | 21.1 | 24.5 | 4 | 0.6 | 213 |
| Oct | 26.8 | 20.0 | 23.4 | 12 | 1.6 | 214 |
| Nov | 24.8 | 18.2 | 21.5 | 26 | 1.9 | 193 |
| Dec | 22.8 | 16.5 | 19.7 | 30 | 3.5 | 195 |
AEMET publishes the south station's annual total as 132 mm of rain on 15.2 days with at least 1 mm. That is drier than most of Mediterranean Spain in summer, and the rain that does fall is concentrated in November, December and February.

For a deeper read on any single month, the month guides cover what the numbers mean in practice: Tenerife in January, Tenerife in February and Tenerife in March for the mild winter, Tenerife in April and Tenerife in May for the dry spring, and Tenerife in October, Tenerife in November and Tenerife in December for the autumn shoulder season.
What Is Tenerife's Coldest Month?
January is Tenerife's coldest month at every coastal station: the mean daily maximum is 21 C in Santa Cruz, 21.7 C at Tenerife South Airport and 16 C at Tenerife North Airport, and the mean daily minimums fall to 15.4 C, 15.2 C and 10.2 C respectively. On the Izana ridge the coldest month is also January, with a mean daily maximum of 7.5 C and a mean daily minimum of 1.1 C.
"Coldest" on this island is a matter of where you stand. The coastal January figures are warmer than a British or German summer day on average, which is why the winter months are among the busiest for arrivals: 649,614 tourists arrived by air in January 2026, against 518,359 in May of the same year. Up on the volcano the same month is genuinely wintry, with 47 mm of rain at Izana and overnight minimums barely above freezing on average.
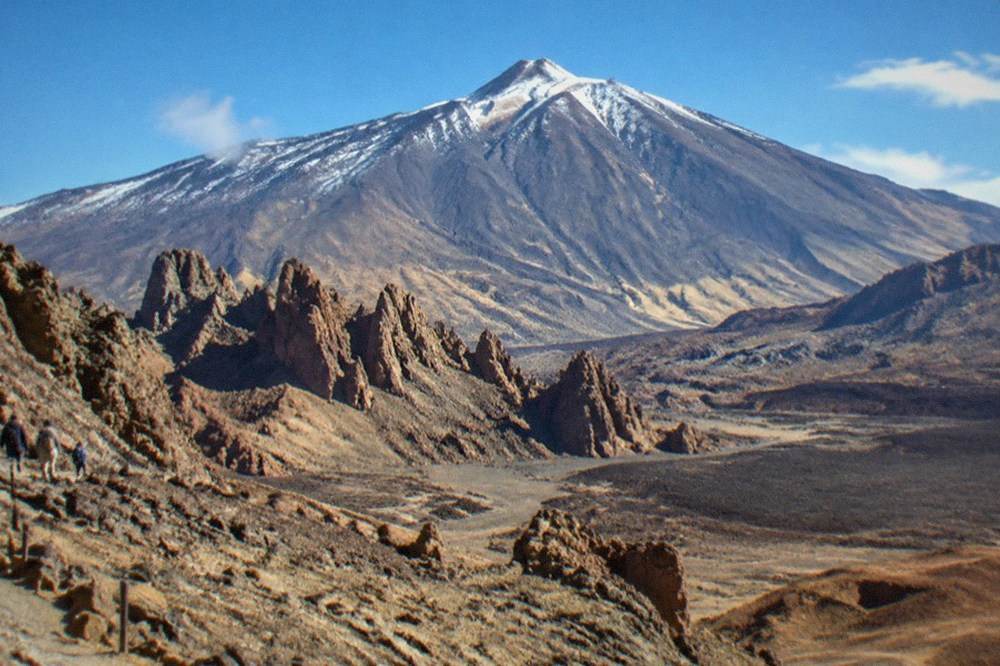
The north of the island is the wetter, greener half, and the station figures show it plainly. Tenerife North Airport sits at 632 m and records 520 mm of rain a year on 64 days with at least 1 mm, four times the south station's 132 mm on 15.2 days. The trade winds pile cloud against the northern slopes, which is exactly why those slopes are green and the south is a near-desert. The comparison between the two halves of the island, including which one suits which kind of holiday, is covered in full in Tenerife North vs South.
| Month | North max C | North min C | North rain mm | South max C | South min C | South rain mm |
|---|---|---|---|---|---|---|
| Jan | 16.0 | 10.2 | 80 | 21.7 | 15.2 | 17 |
| Feb | 16.7 | 10.0 | 70 | 22.0 | 15.0 | 20 |
| Mar | 18.2 | 10.7 | 61 | 23.1 | 15.6 | 15 |
| Apr | 18.5 | 10.9 | 39 | 23.1 | 16.0 | 7 |
| May | 20.1 | 12.0 | 19 | 23.9 | 17.0 | 1 |
| Jun | 22.2 | 14.0 | 11 | 25.4 | 18.8 | 0 |
| Jul | 24.7 | 15.7 | 6 | 27.7 | 20.2 | 0 |
| Aug | 25.7 | 16.6 | 5 | 28.4 | 21.1 | 1 |
| Sep | 24.9 | 16.5 | 16 | 27.9 | 21.1 | 4 |
| Oct | 22.5 | 15.2 | 47 | 26.8 | 20.0 | 12 |
| Nov | 19.6 | 13.3 | 81 | 24.8 | 18.2 | 26 |
| Dec | 17.1 | 11.5 | 82 | 22.8 | 16.5 | 30 |
The north is also a few degrees cooler at the coast. Santa Cruz, on the north-eastern shore but sheltered by the Anaga massif, runs warmer than either airport station, which shows how much the mountains steer the local climate.
Why Is It So Cold in Tenerife at the Moment?
If Tenerife feels cold, it is almost always altitude, wind or cloud, not latitude: the coastal stations never average below 15 C at night, but the Izana ridge at 2,369 m averages 1.1 C overnight in January and 4.3 C as its daytime mean. A day that begins at 24 C in Costa Adeje can end near freezing on Teide's upper slopes, and the trade winds can make a 20 C afternoon feel several degrees cooler on the water.
The altitude effect is the big one, and it is measurable. The cable car base station sits at 2,356 m and the upper station at La Rambleta at 3,555 m, and AEMET's Izana figures are the best proxy for what that band of mountain feels like. The table below is the ridge's own climate, and it deserves a moment of study, because plenty of visitors book a Teide trip in shorts and discover a genuinely alpine day.
| Month | Mean daily max C | Mean daily min C | Mean C | Rain mm | Rain days 1 mm+ | Sunshine hours |
|---|---|---|---|---|---|---|
| Jan | 7.5 | 1.1 | 4.3 | 47 | 4.5 | 226 |
| Feb | 8.0 | 1.3 | 4.7 | 67 | 4.0 | 223 |
| Mar | 10.2 | 2.7 | 6.4 | 58 | 4.1 | 260 |
| Apr | 11.8 | 3.5 | 7.6 | 18 | 2.7 | 294 |
| May | 14.5 | 5.8 | 10.1 | 7 | 1.1 | 356 |
| Jun | 18.9 | 9.9 | 14.4 | 0 | 0.2 | 382 |
| Jul | 23.0 | 14.0 | 18.5 | 0 | 0.1 | 382 |
| Aug | 22.6 | 13.8 | 18.2 | 5 | 0.5 | 358 |
| Sep | 18.6 | 10.4 | 14.5 | 13 | 1.6 | 295 |
| Oct | 14.3 | 6.9 | 10.6 | 37 | 3.7 | 259 |
| Nov | 11.1 | 4.5 | 7.8 | 54 | 4.4 | 220 |
| Dec | 8.8 | 2.4 | 5.6 | 60 | 5.6 | 218 |
Two things in that table surprise people. The ridge gets more sunshine hours than the coast in most months, peaking at 382 in June and July, because it sits above the trade-wind cloud layer. And winter up there brings ice and snow: Tenerife ON's rules add crampons and an ice axe to the mandatory equipment list on the stratovolcano trails when conditions demand them, together with a signed declaration. Anyone planning the summit trail should read the Teide summit permit guide before choosing a date, and anyone wondering whether the volcano itself is a live concern can check Is Mount Teide Active?.
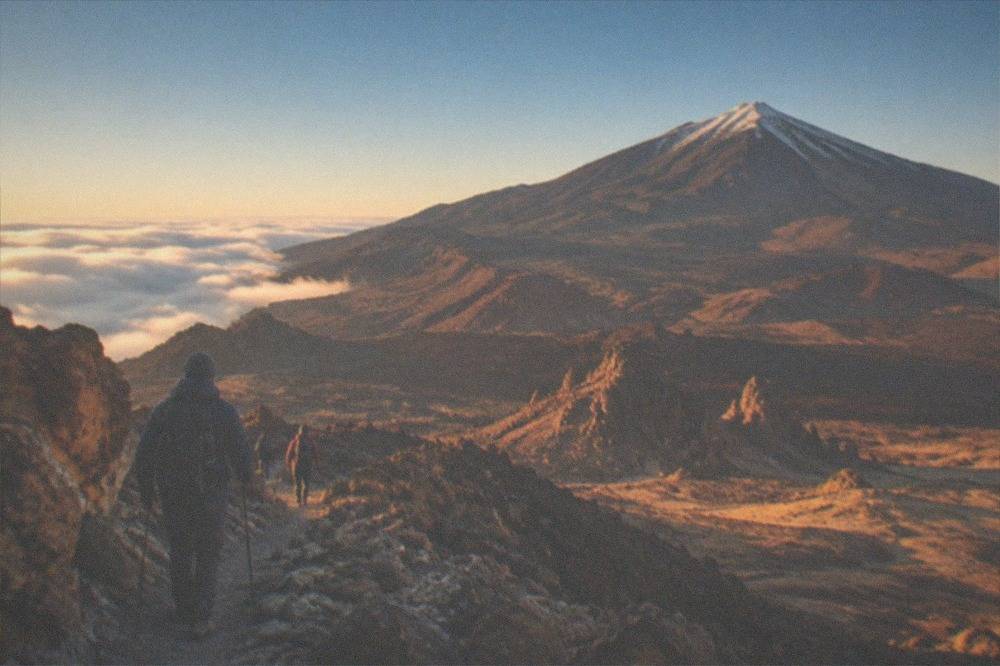
The second reason a warm island can feel cold is the wind. The same trade winds that water the north blow steadily across the southern coasts, and on a boat or at altitude they strip heat fast. The cable car operator's own access rules refuse the ride to people with cardiovascular conditions, pregnant women and children under 3 because of the altitude, and tell anyone with a health problem to ask a doctor first. That is a weather-adjacent rule worth respecting: the top station is 1,200 m higher than the ridge station, and colder still.
A well-run Teide day trip handles the clothing problem for you, with pickup from the south coast and the climb timed to the cable car's hours. Check availability for the cable car tour with transfer, or read the wider options on the Teide tours page.
How Warm Is the Sea Around Tenerife?
Sea surface temperatures off Tenerife's south coast range from 19.1 C in March to 23.7 C in September and October, on NOAA's 1991 to 2020 normals. The water is at its warmest in late summer and early autumn, at its coolest in February and March, and never drops below 19 C on the monthly averages. These figures come from a different dataset and period from the AEMET air normals, so the two are never quoted as one.
The sea's calendar does not match the air's. Air temperatures peak in July and August, but the ocean keeps warming through September and holds its heat into October, which is one reason the autumn months suit swimmers and divers so well. In February and March the air already feels spring-like on the south coast while the sea is at its yearly minimum, a gap worth knowing before booking a winter swimming holiday.
| Month | Sea surface C | Month | Sea surface C |
|---|---|---|---|
| Jan | 19.9 | Jul | 22.2 |
| Feb | 19.2 | Aug | 23.1 |
| Mar | 19.1 | Sep | 23.7 |
| Apr | 19.5 | Oct | 23.7 |
| May | 20.2 | Nov | 22.5 |
| Jun | 21.4 | Dec | 21.1 |
Sea state matters as much as sea temperature for anything on the water. The whale-watching boats out of Los Gigantes and Los Cristianos run all year against these temperatures, and the calmest conditions matter more than the warmest. The sailboat cruise from Los Gigantes is the trip most dependent on a gentle sea, and it is the one this desk would point swimmers and wildlife watchers alike towards.
The rules that protect the animals are fixed year-round: Decreto 178/2000 bars boats from approaching within 60 m, allows at most three boats within 500 m, sets 4 knots inside 500 m and forbids swimming within 500 m, and authorised boats fly the Barco Azul flag. None of that changes with the season, but sea conditions do, and the full picture is on the whale and dolphin watching page.
When Does Rain Fall in Tenerife?
Rain on Tenerife falls overwhelmingly between November and February, and almost never between May and August: Tenerife South Airport records 0 mm in both June and July, and 30 mm in December, while the north station records 82 mm in December against 5 mm in August. Santa Cruz follows the same calendar, with 43 mm in December and 0 mm in July, and AEMET's annual totals are 132 mm for the south station and 520 mm for the north.
The dry summer is the island's most reliable weather feature. From May through August the south is effectively a desert, with rain days at or near zero, and even the north sees its monthly rainfall fall to single figures. The wet season, such as it is, runs from late October through February, and even then a wet day in the south is the exception rather than the rule: December, the wettest month at the south station, averages 3.5 rain days.
| Month | Santa Cruz max C | Santa Cruz min C | Santa Cruz rain mm | Rain days 1 mm+ | Sunshine hours |
|---|---|---|---|---|---|
| Jan | 21.0 | 15.4 | 32 | 4.2 | 178 |
| Feb | 21.2 | 15.3 | 35 | 3.8 | 186 |
| Mar | 22.1 | 15.9 | 38 | 3.8 | 221 |
| Apr | 22.7 | 16.5 | 12 | 2.4 | 237 |
| May | 24.1 | 17.8 | 4 | 0.9 | 282 |
| Jun | 26.2 | 19.5 | 1 | 0.2 | 306 |
| Jul | 28.7 | 21.2 | 0 | 0.0 | 337 |
| Aug | 29.0 | 21.9 | 2 | 0.3 | 319 |
| Sep | 28.1 | 21.7 | 7 | 0.9 | 253 |
| Oct | 26.3 | 20.3 | 19 | 3.1 | 222 |
| Nov | 24.1 | 18.4 | 34 | 4.7 | 178 |
| Dec | 22.1 | 16.6 | 43 | 5.4 | 168 |
AEMET publishes Santa Cruz's annual figure as 226 mm of rain on 29.7 days with at least 1 mm. The capital is wetter than the south airport but far drier than the north, and its sunshine hours dip lowest in December, at 168, which is still more than most of northern Europe sees in a summer month.
One caution on the ridge: no annual rainfall total for Izana appears on this page, because AEMET's published annual figure and the sum of its monthly values disagree, and this desk does not print a number it cannot reconcile. The monthly Izana values in the table above are safe to use, and they show the same wet-winter pattern, with February the ridge's wettest month at 67 mm.
Is the Weather Bad in Tenerife at the Moment?
"Bad" weather on Tenerife is usually local and short-lived: a north-coast morning can be grey while the south is in full sun, rain rarely lasts all day, and the genuinely disruptive conditions are high-wind alerts, wildfire closures and rough seas rather than cold. Tenerife ON warns that trail bookings can be suspended for fire risk or weather alerts, and the Masca operator states that sudden pier closures from sea conditions void that day's ticket.
The practical risks are specific and worth naming. The Cabildo bans smoking in every open-air space of Teide National Park, trails and car parks included, as a wildfire measure, and fire-risk alerts can close routes outright. The Masca gorge operator calls the gorge the place with the most rescues in the Canaries in recent years and states that the pier can close suddenly when the sea turns. Winter ice on the stratovolcano trails triggers the crampon and ice axe rule. None of these is a reason to avoid the island, but each is a reason to check the official alerts page on the morning, not the evening before.
For days when the cloud does sit low, there are indoor and sheltered options that do not depend on the forecast, and the rainy day itinerary collects them. The month guides for the shoulder seasons, Tenerife in June, Tenerife in July, Tenerife in August and Tenerife in September, cover the other end of the calendar, when the question is sun exposure rather than rain.
Are the Canary Islands Warm All Year?
Yes, on the coastal averages: every one of Tenerife's three low-level stations records a mean daily maximum of at least 16 C in its coldest month, and the south coast never averages below 21.7 C by day in any month of the year. The Canary Islands as a group sit in the subtropical Atlantic, and Tenerife's winter is milder than mainland Spain's. The exception is the high mountain interior, where January's mean daily maximum on the Izana ridge is 7.5 C.
The islands' reputation for year-round warmth is well founded at sea level, and the visitor numbers show people acting on it: 643,460 tourists arrived by air in January 2025 and 631,662 in October 2025, months that in most of Europe are firmly off-season. The monthly arrival series below shows the shape of the year.
| Month | Arrivals by air 2024 | Arrivals by air 2025 |
|---|---|---|
| Jan | 612,169 | 643,460 |
| Feb | 632,295 | 648,255 |
| Mar | 678,693 | 677,688 |
| Apr | 578,602 | 604,370 |
| May | 528,408 | 539,410 |
| Jun | 522,461 | 542,881 |
| Jul | 580,512 | 611,623 |
| Aug | 603,529 | 618,578 |
| Sep | 551,175 | 563,261 |
| Oct | 617,714 | 631,662 |
| Nov | 652,800 | 659,656 |
| Dec | 679,245 | 671,202 |
These figures count tourists arriving by air, excluding Canary Islands residents, and they are the only series behind the chart below. The tourist board's separate 2025 totals measure different things, tourists lodged in hotels and apartments among them, and are never printed beside this series as if the two disagreed.
The pattern is telling: the busiest air-arrival months are March and December, and the quietest are May and June, before the sea has warmed. Visitors, in other words, already follow the weather, favouring the mild winter and the warm autumn over the early summer.
Which Month Should You Choose for a Tenerife Trip?
For beach weather and the warmest sea, choose September or October, when the sea surface averages 23.7 C and the south coast still averages 26.8 to 27.9 C by day. For hiking without summer heat, choose March or April, with south-coast maxima around 23 C and 7 to 15 mm of rain. For the mildest escape from a northern winter, December and January deliver 21.7 to 22.8 C by day on the south coast, with the sea at 19.9 to 21.1 C.
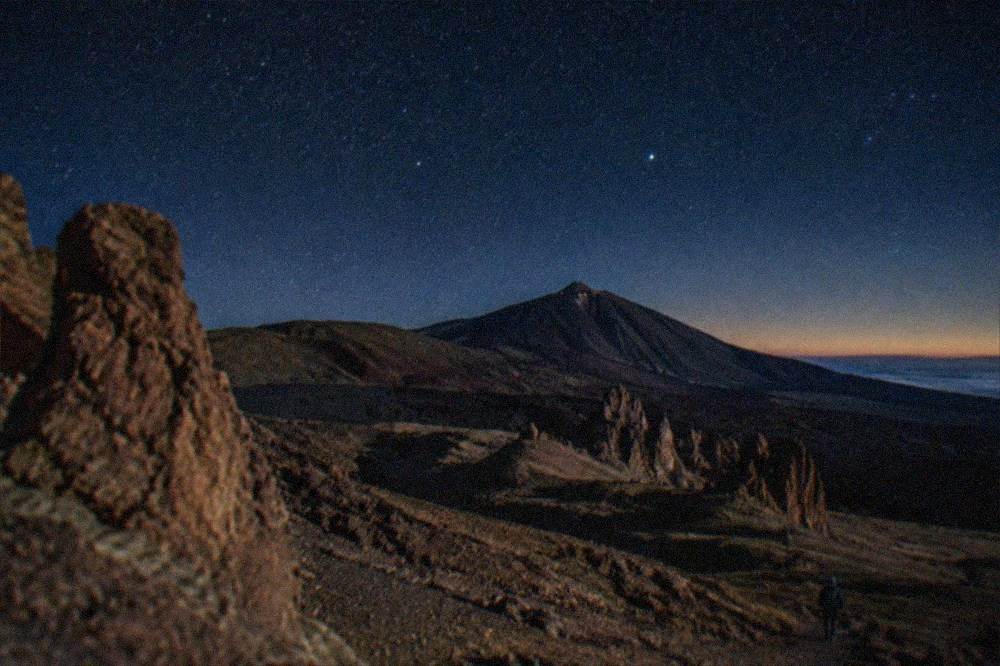
The honest answer is that the wrong month barely exists at sea level, and the choice is really about what you want to do. Swimmers should follow the sea table and aim for late summer or autumn. Hikers should follow the rain table and the altitude table together: the dry months of May and June are the most reliable for the high trails, and the Izana figures show why winter walking above 2,000 m is a different sport, with 47 to 67 mm of monthly rain and minimums near freezing. Stargazers have the driest, clearest calendar of all, and the ridge's sunshine figures show why the observatory sits where it does.
Families planning around school holidays will find the answer on the best time to visit breaks the year down by crowd levels as well as weather, and the things to do in Tenerife guide matches each season to the activities that suit it. Anyone comparing islands before committing will find the climate carries over in Tenerife vs Gran Canaria, Tenerife vs Lanzarote and which Canary island is best.
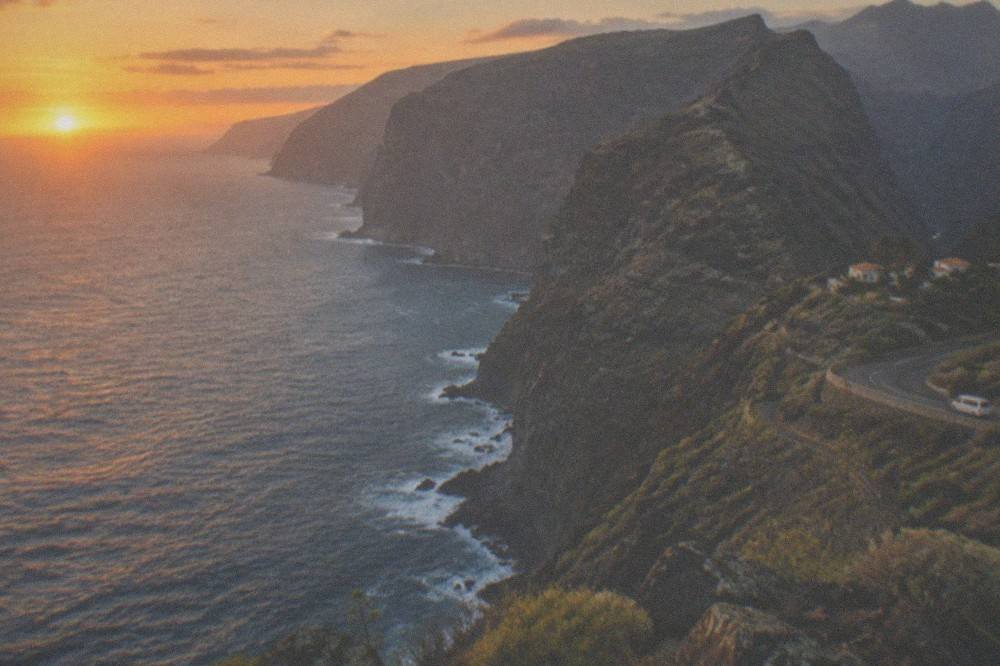
Whatever the month, the trips that depend on conditions, the boat out to the whales, the cable car up the volcano, the park day with the family, are the ones worth securing ahead, and the boat trips and catamarans page collects the options that hinge on a calm sea.
Common Questions About Tenerife Weather
how hot is it in the canary islands right now?
This page carries climate normals, not a live forecast, so it cannot tell you the temperature at this moment. What the records do establish is the range you can expect: the south coast of Tenerife averages 21.7 C by day in its coolest month and 28.4 C in its warmest, so "right now" is almost always somewhere between those figures at sea level. For a live reading, check AEMET's current observations for the island.
is it warm in tenerife right now?
On the monthly averages, yes at the coast in every month of the year: the lowest mean daily maximum recorded at any of the three low-level stations is 16 C at Tenerife North Airport in January, and the south coast stays above 21 C by day all year. The exception is the high mountain interior, where the Izana ridge averages 7.5 C by day in January. A live forecast will tell you where today sits against those averages.
is the weather bad in tenerife at the moment?
The normals show no month with genuinely bad weather at the coast: even the wettest, December, averages only 3.5 rain days at the south airport. What can genuinely disrupt a day is specific: high-wind alerts, wildfire-related trail closures in Teide National Park, or rough seas closing the Masca pier. Tenerife ON's alerts page is the official source for trail conditions, and the boat operators post on sea state.
what is the coldest month in the canary islands?
For Tenerife, the station records put January as the coldest month at every one of the four AEMET stations, from 16 C by day at the northern airport to 7.5 C on the Izana ridge. The Canary Islands share the same subtropical Atlantic regime, so January is the coldest month across the archipelago on the same pattern, though each island's stations publish their own figures.
why is it so cold in tenerife at the moment?
Almost always because of altitude or wind rather than the season. The island's mountains lift a visitor from a 21 C coastal afternoon to a ridge that averages 4.3 C by day in January, and the trade winds cool the coasts steadily, especially on the water. If the coast itself feels unusually cool, the likely cause is a spell of stronger trade winds or cloud pushed against the northern shore, both of which the forecast will show.
are the canary islands warm all year?
At sea level, yes: Tenerife's three low-level stations all record mean daily maximums of at least 16 C in the coldest month, and the south coast never averages below 21.7 C by day in any month. The high volcano is the exception, with sub-zero average nights in winter on the Izana ridge. The sea stays between 19.1 and 23.7 C on the monthly averages, which is what makes year-round swimming plausible even in January.